Hub Dashboard
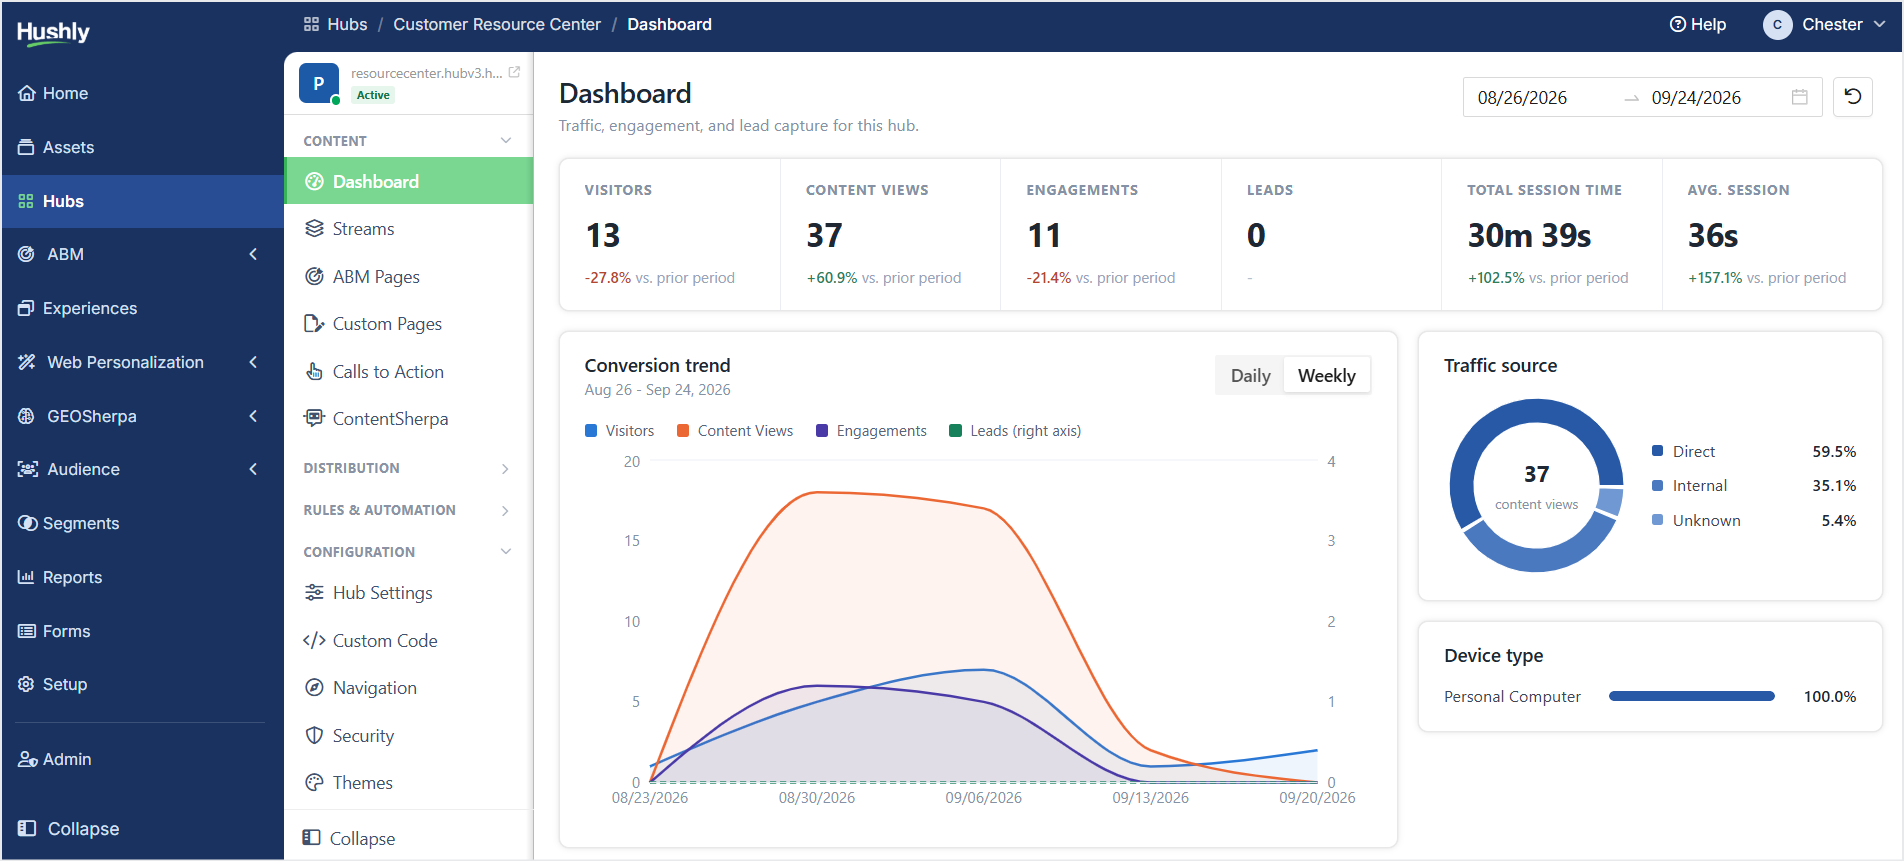
The Dashboard provides an overview of traffic, engagement, and lead-capture activity for the Hub. Use the date range selector in the upper-right corner to view data for a specific period.
Dashboard metrics
The Dashboard displays the following key metrics:
- Visitors – Number of visitors to the Hub during the selected period.
- Content Views – Number of times content was viewed.
- Engagements – Number of visitor interactions or engagements recorded.
- Leads – Number of leads captured through the Hub.
- Total Session Time – Total time visitors spent on the Hub.
- Avg. Session – Average time spent by a visitor during a session.

Conversion trend
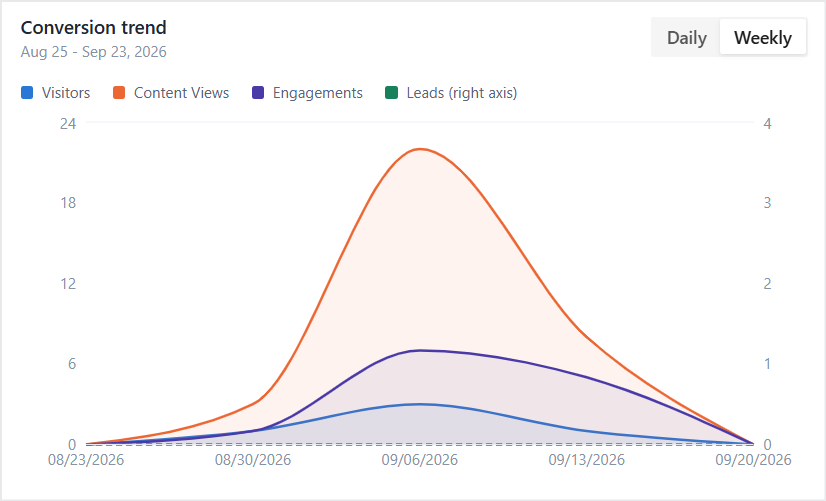
The Conversion trend section shows activity trends for the selected date range. Use the Daily or Weekly (selected by default) option to change how the data is grouped.
Traffic source
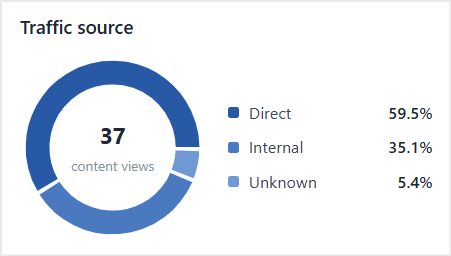
The Traffic source section shows where Hub traffic originates, helping you understand the sources that drive visitors to the Hub.
Device type
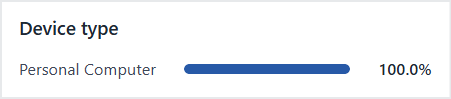
The Device type section provides a breakdown of visitors based on the devices they use to access the Hub.
Top content
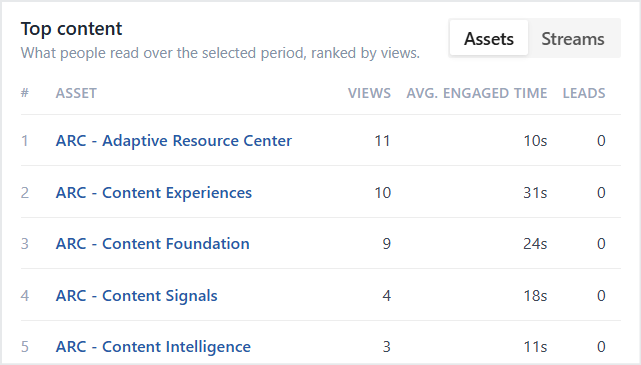
The Top content section shows the content that received the most views during the selected period. Use the Assets and Streams tabs to view the top-performing assets or streams.
Leads
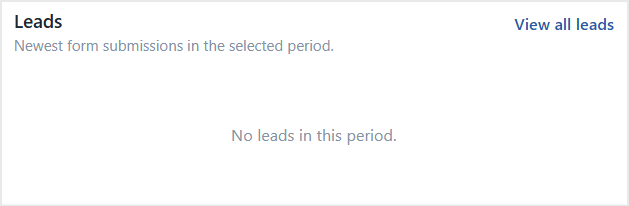
The Leads section displays the newest form submissions captured during the selected period. Click View all leads to view the complete list of leads.
Note: If there is insufficient data for the selected period, the Dashboard displays a message indicating that you should check back once there is traffic.
Was this article helpful?
That’s Great!
Thank you for your feedback
Sorry! We couldn't be helpful
Thank you for your feedback
Feedback sent
We appreciate your effort and will try to fix the article